
Changes in attitude towards the government during the COVID-19 pandemic: A UK case study
The focus of this study is UK citizens' changes in attitude towards the government during the COVID-19 pandemic. The study was conducted using a mixed-method design called ethnomining, a combination of data mining and ethnography.
Covid-19 in the UK
At the end of 2019, COVID-19 emerged in China. In several short months the disease had spread across the world, leading to a global pandemic. There have been over 63 million coronavirus cases and 1.47 million deaths worldwide. The virus is spread through droplets in the air released while coughing or sneezing. Inhaling droplets from an infected person can lead to infection. Each country has developed its own strategy to prevent the spread of the virus; this study will focus on the United Kingdom (UK). In total, there have been 1.6 million coronavirus cases and 58 thousand deaths in the UK.
The first coronavirus cases in the UK were confirmed on January 31st, 2020. Following a sharp rise in coronavirus cases and deaths, Prime Minister Boris Johnson announced the first lockdown on March 23rd, 2020. During this lockdown, everyone was ordered to stay at home as much as possible. Shops, schools, restaurants, gyms, and other publice spaces were closed, gatherings with people outside the household were not allowed, and all of these measures were enforced by police.
After three weeks, these measures were eased as the number of cases decreased. Unfortunately, the coronavirus cases started to rise again later that year, and a second lockdown was announced beginning on November 5th, 2020. This lockdown consisted of the same measures as the first lockdown, with the exception of allowing schools to stay open. The second lockdown lasted for four weeks.
Citizens' attitudes
During this pandemic, everyone has formed their own opinion about the virus and government measures. Maher et al. (2020) found that a clear had gap emerged between two groups of people, characterized by either their trust or distrust in science. These groups also differed in their public health behavior. Normally, public trust in health officials is not an issue in the UK. However, during the pandemic, people have sought more clarity and certainty. A short follow-up study also showed that the division between trust and distrust in science partially reflects existing social differences in the UK, both political and socio-economic (Maher et al., 2020).
This study will focus on attitude changes among UK citizens during the COVID-19 pandemic, specifically: How have UK citizens' attitudes towards the government changed over the course of the first and second COVID-19 lockdowns?
Data mining and digital ethnography
This research question will be answered using ethnomining, a mixed-method design that combines data mining and ethnography (Aipperspach et al., 2006). Reflective of our mixed-methods apporach, we split our research question into two sub-questions. First, data mining will be used to answer our first sub-question: Is there a change in UK citizens’ attitude towards the government between the first and the second lockdown? Second, digital ethnography will be used to answer the second sub-question: How can this change in attitude towards the government be explained? The data set examined consists of six YouTube videos from the BBC News YouTube channel. We will analyze the comments on the YouTube videos in which the first and the second lockdown are announced.
The British government announced each lockdown through a press conference. These press conferences were broadcast by various news channels, either on television or online. Almost every British news station has a channel on the popular online platform YouTube, where many posted videos of these press conferences. YouTube, unlike television, has the option to comment on videos. The comments section will be used here to analyze the change in attitudes during the COVID-19 pandemic.
It is both academically and socially relevant to investigate UK citizens’ change in attitude towards the government. This study will fill a gap in the literature, as there is no previous study that gives a clear overview of attitude changes during the pandemic. Our study is especially interesting as it is longitudinal analysis. Furthermore, this study’s outcome could be interesting for the UK government to see how their citizens have responded to the COVID-19 measures.
This paper will consist of the following sections: first, a theoretical framework is presented in which we delve deeper into previous studies and relevant concepts. Based on these concepts and previous research, a hypothesis is then constructed. Second, we will discuss our data selection and methodology. Third, we will report our findings, followed by a discussion and conclusion.
The lockdown dilemma
As the COVID-19 situation worsened in spring 2020, Prime Minister Boris Johnson, implemented a national lockdown on March 23rd. According to Lacobucci (2020), this was an attempt to reduce the spread of coronavirus after earlier physical restrictions had not been effective. At the start of the lockdown, there had been 335 fatal COVID-19 cases in the UK. The decision was urged by hundreds of doctors and health experts on the basis of scientific evidence and success in other countries. Apart from preventing virus transmission and saving lives, the measure was also expected to alleviate pressure from the National Health Service (NHS). With the simple requirement of ‘staying at home’, the measure was dependent on individual agency to deal with the outbreak.
Implemented in concert with other measures, namely social distancing, isolation, and contact tracing, a national lockdown entailed implications at a macro level. In his proposal for an exit strategy, Peto et al. (2020) points out that despite its efficacy, a long lockdown period would damage the country’s economy and society. They therefore suggest an alternative scheme to balance the benefits and shortcomings of strict isolation measures, namely ‘universal repeated testing’, which would narrow down strict isolation to household units. If enforced, household members of infected people would have to stay in quarantine until all household members test negative. Meanwhile, the NHS would manage the untested with the aid of data from hospitals, general practitioners, and mobile tracking applications.
Attitudes and politicalization on Twitter
As early as in March 2020, Thelwall and Thelwall (2020) carried out a qualitative study on highly retweeted English-language tweets relevant to COVID-19. They identified nine dominant themes in the discourse surrounding coronavirus on Twitter: lockdown life, attitudes towards COVID-19, relevant political issues, safety messages, people with COVID-19 as a patient or a relative of a patient, support for key workers, work-related matters, and daily symptoms of COVID-19. Some of these points overlap or connect with each other.
Doubts regarding whether the virus was serious resulted in distrust in the government and mainstream media and politicization of the outbreak.
The most outstanding theme was attitudes towards the virus. Despite being taken seriously in general, the issue was also addressed with humor, which undermined the urgency and necessity of preventative measures, such as social distancing and lockdown. On the one hand, serious uptake of the situation led to the sharing of safety messages and public health information as a form of support. There was also 'wholesome' content expressing gratitude to front-line health workers and essential workers.
On the other hand, doubts regarding whether the virus was serious resulted in distrust in the government and mainstream media and politicization of the outbreak. It is pointed out by Thelwall and Thelwall (2020) that the political aspect of COVID-19 was heavily emphasized and widely circulated on Twitter. They highlight that while not being exclusive to the COVID-19 pandemic, such attention was higher than that observed in other public health campaigns, such as those against smoking. These tweets revealed oppositional viewpoints on novel public health regulations and government agency. Consequently, this reveals government shortcomings in monitoring the situation efficiently, particularly in relation to public health and new working conditions.
While the data were collected before and slightly after the first lockdown in the UK, and concerned a population of English tweeters wider than those of English-speaking countries, let alone the UK, the research provides an overview of popular existing attitudes toward coronavirus. Thelwall and Thelwall's (2020) findings and discussions facilitate further examination of how COVID-19 and preventative measures are perceived in the UK.
Government mistrust
Trust in government management of COVID-19 has become a major challenge worldwide. A study by Fancourt et al. (2020) showed that political decisions can have negative and lasting consequences for public trust and risks behaviors. They specifically examine the Cummings effect, refering to Dominic Cummings, a British political strategist who broke lockdown rules by travelling 420 km to a family estate with his wife (who had suspected COVID-19) and child. This scandal led to a significant decrease in public confidence in the UK government.
Fancourt et al. (2020) further argue that trust in the government’s ability to manage the pandemic underpins attitudes and behaviors at a precarious time for public health. Trust is related to people’s willingness to follow COVID-19 rules and guidelines, which is fundamental to the control of infection and mortality.
A survey of 2,250 UK residents conducted in April 2020 investigated people’s attitudes towards the government’s response to the coronavirus. They found that people were skeptical about the government’s overall response: 42% felt that it had been confusing and inconsistent. Many more (67%) agreed that the government acted too slowly in controlling the virus' spread. However, respondents were more positive regarding how the government has modified its strategy throughout the crisis. They were generally supportive of the lockdown measures and increased police power to enforce these restrictions. The public had relatively high levels of trust in the government’s ability to control the spread of coronavirus. Similarly, 76% said they trusted the information the government provided (Duffy, 2020).
In contrast, Fletcher et al. (2020) found in May 2020 that trust in the UK government as a source of information about coronavirus had declined substantially. Trust in news organizations also declined from 57% to 46%. In addition, they also found a significant increase in concerned about false or misleading information coming from the UK government. Duffy (2020) states that significant numbers have misunderstood government advice, and many believe common false claims about the virus and the measures to tackle it. A quarter of the public believed the conspiracy theory that coronavirus was created in a laboratory – and this increases to 45% among those who say they oppose the government’s lockdown measures. Given such attitudes, these people would deem the lockdown a form of governmental control over their freedom.
Optimism and resistance
Resistance to lockdowns can also happen for non-political reasons. Asimakopoulou et al. (2020) conducted a survey of UK adults during COVID-19 on comparative optimism during controllable events. Carried out after the first lockdown, the study revealed findings coherent with its theoretical background. Respondents in general were optimistic that, in comparison with their counterparts, they had not accidentally infected anyone. They also believed it unlikely they would become infected or infect others in the near future. This helps to explain lax attitudes towards social distancing and lockdown, as people do not believe such measures are necessary for them as individuals.
Nevertheless, looking farther into the future, respondents were more pessimistic. Isolation-related measures were believed to be improbable to last for a long time and have significant ramifications. Indeed, implications of the lockdown on a national scale are reflected on in Peto et al.'s (2020) work. They point out its detrimental effects on society and the economy and thus propose an alternative strategy.
White & Van Der Boor (2020), on the other hand, report the impacts of isolation after the first lockdown on the individual level. Participants reported higher levels of anxiety and depression; this occurred to those experiencing isolation both before and during the lockdown. Another contributing factor is the concern for their quality of life and livelihood. This does not necessarily mean that isolation measures operate solely at the expense of the individual for the sake of public health. Rather, the detrimental effects can be alleviated by kindness and support, which boosts local solidarity and community, and the spirit of front-line and essential workers.
However, as Asimakopoulou et al. (2020) discuss, the consequences of lockdown worsen attitudes towards it and thus foster resistance. In light of these findings, they suggest further research on behaviors resulting from comparative optimism in regard to work, school, and life prior to the pandemic.
Big data research and COVID-19
As we have reviewed above, research on COVID-19 can be conducted with both manually collected data and big data, the latter of which was used in Thelwall & Thelwall (2020). In their research, data was collected from Twitter in light of of its role in information dissemination in preceding public health campaigns, its user culture, and its technological affordances. Big data collection is an appropriate method for dealing with the vast amount of content on the platform.
Thelwall & Thelwall (2020) identified a number of key themes in COVID-19-related, highly-retweeted tweets. While the study provides some insight into people's thoughts during a global health crisis, the study did have some limitations. First, the insights were based on existing research. Based on this, certain patterns of behavior were identified, and attempts were made to gauge people’s motivation for retweeting or estimate the impact of their retweeting practices. Given only tweets' text were examined, only textual data was obtained and people’s behavior could not be observed. This leads to the second point - the limited extent of the insights gained from the study. Despite revealing people’s attitudes and the strong connection between COVID-19 and politics, it only provided insights into information-based themes at a general level. Nuances related to particular locations or individuals were insufficiently covered.
Another big data study concerning COVID-19 was conducted by Marchal & Au (2020). This study investigated the content and quality of COVID-related information on YouTube, as it is a popular and major source of information. Using the search terms like ‘coronavirus UK’, ‘coronavirus China’, ‘coronavirus symptoms’, and ‘coronavirus conspiracies’, 320 videos were gathered and analyzed. The study found that professional news agencies disseminated much of the information and search terms most often returned videos of factual and neutral information. However, more comments were left under highly politicized videos than under neutral ones. This last point resonates with Thelwall & Thelwall's (2020) finding unprecedented politicization of public health campaigns.
Focusing on the quality and type of the information returned to COVID-19-related search queries on YouTube, Marchal et al. (2020) do not provide further insights into YouTube users’ engagement with the videos featuring highly politicized content. The videos were analyzed for their themes and topics, however, without an investigation of commenters’ discourse, it is difficult to understand their motivation for commenting and other individualized aspects.
Hypothesis
Given the above review of COVID-19 related research, it is apparent that the lockdown was not well-received by many UK residents. This phenomenon was caused by many factors, both external and internal to the people themselves. The factors are as follows: First is the politicization of COVID-19. Special attention was paid to the political aspects of COVID-19. This was observed in COVID-19-related highly retweeted tweets (Thelwall & Thelwall, 2020), and the number of comments made on relevant and highly politicized Youtube videos (Marchal et al., 2020).
Second, the politicization of COVID-19 is connected to public trust, which reflects public confidence in the government’s handling of the situation (Fancourt et al., 2020). Public trust in the UK government decreased considerably after the first national lockdown (Fletcher et al., 2020). The public found government guidelines to be ambiguous and inconsistent (Duffy, 2020) or even false and misleading (Fletcher et al., 2020). On the other hand, political figures violating lockdown restrictions could also weaken public trust (Fancourt et al., 2020).
Third, negative perspectives on the government and its policies resulted in certain patterns of opinions. Those accusing the government of providing false information regarded COVID-19 as a conspiracy (Thelwall & Thelwall, 2020; Fletcher et al., 2020). Meanwhile, those who did not believe in the efficacy and necessity of the lockdown were resistant to it (Asimakopoulou et al., 2020).Fourth, there were both societal and individual implications of the lockdown. Regarding the economy, the lockdown posed long-term threats to economic stability and people’s livelihoods (Peto et al., 2020; White & Van Der Boor, 2020). A long period of isolation, on the other hand, raised depression and anxiety levels (White & Van Der Boor, 2020). While these phenomena could be somewhat countered by positive government messaging, they could also further exacerbate negative attitudes towards lockdown.
The four aforementioned points, drawn from existing research, make up the theoretical framework for our paper. Given that, we formulated our research hypothesis: People’s attitudes towards the UK government became more negative upon the announcement of the second lockdown.
Mixed methods approach
This research utilizes mixed methods, meaning that a combination of quantitative and qualitative research methods were used to carry out this study. Mixed methods research is relatively new and is helpful in that it utilizes the strengths of qualitative and quantitative research, resulting in an expanded depth and width of understanding (Creswell, 2009). Specifically, this study uses ethnomining. Ethnomining refers to a combination of ethnography (qualitative research) and data mining (quantitative research) (Aipperspach et al., 2006).
Our research uses sequential explanatory design, meaning we first gathered and analyzed quantitative data, after which we gathered and analyzed qualitative data (Creswell et al., 2003, pp. 209-211). The ‘explanatory’ part of this research design is essential, because “a sequential explanatory design is typically used to explain and interpret quantitative results by collecting and analyzing follow-up qualitative data” (Creswell et al., 2003, p. 211). Since we aimed to explain quantitative data using qualitative data, sequential explanatory design is fitting for this research.
The structure of this research is the result of two research sub-questions. Data mining is used to answer the first question: Was there a change in UK citizens’ attitude towards the government between the first and second lockdown? We then answer the second question through digital ethnography: How can this change in attitude towards the government be explained? In this section we will extensively discuss ethnomining in the context of this study.
Data mining
The data mining part of this study was done using the program Mozdeh. Mozdeh is a free social media data analytics software (Thelwall, 2018a; Thelwall, 2020). The program focuses on big data text analysis. Mozdeh can be used to gather social media textual data, like Tweets and YouTube comments, through keyword queries and data filtering. After entering a query and selecting filters you can carry out association mining to list words that associate the query and its filter(s). Lastly, Mozdeh can carry out network analysis, i.e. analyzing the network(s) of people that comment on specific YouTube videos (Thelwall, 2018a; Thelwall, 2020).
As mentioned, the current study focuses on YouTube comments. To understand changes in attitude during the COVID-19 pandemic, we compared comments on videos related to the first lockdown to comments on videos related to the second lockdown. Six videos from the BBC and BBC News YouTube channels, containing a total of 13,256 comments, were included in this study. These channels were chosen because the BBC is the leading TV news channel in the UK. Therefore, by selecting these YouTube channels and their videos, the biggest data set could be gathered. The data set was gathered on November 24th, 2020. More detailed information about the videos, including the number of comments per video, can be found in Appendix A.
Sentiment analysis
We first performed a sentiment analysis on the data set. A sentiment analysis algorithmically determines the mood of social media users, consumers, and the general public (Puschmann & Powell, 2018). In Mozdeh, sentiment analysis is done through the program SentiStrength. This program calculates the positive and negative strength of each comment. The outcome shows a positive sentiment score from 1 (no positive sentiment) to 5 (very strong positive sentiment) and a negative sentiment score from -1 (no negative sentiment) to -5 (very strong negative sentiment) (Thelwall, 2018a).
This analysis was used to detect changes in positive and negative sentiment between the first and second lockdowns. The analysis was performed on three videos from the first lockdown and three videos from the second lockdown. Additionally, we wanted to research the change in people’s attitude towards certain topics related to COVID-19. Therefore, we also performed sentiment analysis on comments that contained certain relevant keywords.
A comparison was made between videos regarding the first lockdown and those regarding the second.
The keywords were chosen are based on the research discussed in the theoretical framework (above). Some recurring themes from the UK news media were also included. The most important keyword(s) for this study are related to the virus itself': 'Coronavirus/Corona/virus/Covid/COVID-19' (1). We included these different designations as one keyword, since they are all widely used to refer to the virus.
The remaining keywords are as follows: ‘government’ (2), ‘measures’ (3 – referring to government policies against the virus), ‘social distancing’ (4) ‘masks’ (5), ‘control (6 - referring to the UK’s lockdown restrictions), ‘freedom’ (7), ‘lockdown’ (8),‘Boris Johnson’ (9), ‘Prime Minister’ (10), ‘school’ (11), ‘vaccine’ (12) ‘conspiracy’ (13 – see Duffy, 2020), ‘propaganda’ (14), and ‘stay safe’ (14) With each of these keywords, a comparison was made between videos regarding the first lockdown and those regarding the second. Through keyword-specific sentiment analysis we aimed to gain a better understanding of precisely which topics saw attitude changes.
Association mining
Second, we performed association mining on the data set. Association mining looks at the frequency of word use to detect commonly used topics and terms associated with these topics (Thelwall, 2018a). This analysis is based on the assumption that frequently used words indicate important topics. Furthermore, words that are barely used are also of interest, as they could potentially refer to taboos. Mozdeh automatically checks for associating terms when a keyword is entered into the search bar. After searching the data set for a certain keyword, Mozdeh creates a list of words that are used more in comments containing the specific keyword than in comments that do not contain the keyword. This list is helpful in identifying emerging topics.
The keywords used for this analysis are the same as those used for the sentiment analysis. outcome of this analysis was used to give insight into the difference between relevant topics during the first and the second lockdown. These changes were reported and used to answer the research questions.
Finally, we used a function in Mozdeh to gather all hashtags used in the YouTube comments section of the included videos. By using a hashtag (#) in a comment - for example #StayStrong - it is easier for other people to find the comment through the search function. While hashtags are most widely used on Twitter, other social media platforms like YouTube use hashtags as well. We used Mozdeh to see which hashtags were most used on the included YouTube videos, since this could generate valuable information for our research.
Limitations
Although Mozdeh is a useful tool for sentiment analysis and association mining, it has its limitations. As described, the sentiment analysis is executed using SentiStrength. To measure the positive or negative sentiment of a specific text, SentiStrength relies on a lexicon of words that all have a rather negative or positive connotation. The program also measures sentiment through the use of emojis, punctuation, and a list of phrases to detect idioms (Thelwall, 2018a, p. 14). Despite this promising basis, there is always the risk of incorrect interpretations, for example with ‘positive’ phrases that contain a lot of sarcasm and are thus actually negative.
Regarding association mining, there are three main limitations to take into account. Firstly, the chi-square values are not conclusive because there is a violation of two assumptions. Therefore, one should interpret the chi-square values as indicative. Secondly, “false positives can occur if the query terms are ambiguous,” and lastly, “false negatives will occur when someone discusses something without explicitly mentioning it” (Thelwall, 2018a, p. 29). It is important to keep these limitations in mind when working with Mozdeh.
Digital ethnography
In the second phase of our sequential explanatory research design, we used a digital ethnographic approach. Instead of solely exploring patterns, we also seek to explain these patterns with this approach. We conducted digital ethnography to add crucial information to and give explanations for the patterns we found through data mining.
Ethnographers try to understand and explain cultural phenomena by looking at them from an insider perspective (Hine, 2015, p. 19). Over the years ethnographic research has evolved, and with the arrival of the internet a new type of ethnography has arisen: digital ethnography, or the study of digital cultural phenomena. Generally speaking, digital ethnography comprises studying situated and contextualized digital practices (Varis, 2016). It is a means to investigate sociocultural norms in online culture and how they shape people’s online behavior. Therefore, “digital ethnography is an approach to studying digital communication” (Varis, 2014, p. 1). As Varis (2014) describes,
“Using the internet, and using language and other semiotic means in doing so, are locally situated experiences and entail locally specific practices, platforms and semiotisations, and ethnography has precisely the means of capturing this, taking the task of understanding informants’ life-worlds and their situated practices and lived local realities.” (p. 4)
By looking at YouTube comments from a digital ethnography perspective, we tried to gain an understanding of how people express their opinions regarding the first and second lockdowns.
In the second phase of our research, we considered the YouTube comments attached to the lockdown announcement videos as “situated and contextualized digital practices” (Varis, 2016). Digital ethnography in the context of this study serves to conceptualize emerging sentiment changes identified during the big data textual analysis conducted in phase one. By examining YouTube comments from a digital ethnography perspective, which includes looking at digital affordances and the semiotic resources people use, we tried to gain an understanding of how people express their opinions regarding the first and second lockdowns.
Discourse analysis
The central question analyzed while conducting digital ethnography was: how do people speak? We have thus examined what people are saying but more importantly how they say things, and what formats, affordances and features they use. To answer these questions we focused on the following: the use of textual memes, the sociolinguistic features used (e.g. the use of capital letters) and “mentions”, or the use of hashtags and tagging people. All of this can be summarized by the term discourse analysis. Simply speaking, discourse analysis is a way of studying (online) texts and other semiotic events (Chick et al., 2015).
In doing discourse analysis we focused on three important features of online social interaction: infrastructure, action, and moralization (Blommaert, 2019). Infrastructure refers to “the material conditions affecting the situation and delineating the affordances available to participants” (Blommaert, 2019, p. 487), or, for example, the ability to comment on YouTube videos and like or dislike other people’s comments.
This is important to keep in mind as the design of a site does not wholly determine people’s communication, but does indeed influence their interactions (Varis, 2014, p. 6). Infrastructure affects what Blommaert calls (social) action - the way people speak online, for example whether or not people have the ability to use emojis. Blommaert describes moralization as the third and last element for analyzing online communication. Moralization, he argues, refers to the negotiation of (online) norms (Blommaert, 2019, p. 488-490).
Limitations
Despite digital ethnography being a helpful approach for understanding people’s relation to digital practices, it also has some limitations. A first limitation is that as a digital ethnographer you can only see what is happening on your screen. More specifically, as an ‘outsider’ one can only partly see how people interact with a digital site, providing you only part of the story. A second limitation is the difficulty of verifying the legitimacy or authenticity of the information people share about themselves online (Varis, 2014, p. 13-14). We took these limitations into account when drawing conclusions from this study.
Data analysis and findings
The first part of this section presents the primary analysis, which includes the sentiment analysis and association mining. After that follows the results of our digital ethnography analysis. To analyze people’s attitudes towards the UK government, we have gathered a large set of YouTube comments. In this research we collected 18.749 comments from six YouTube videos.
Sentiment analysis
In order to examine if there were changes in users’ attitudes, we first measured their sentiments expressed in YouTube comments. At first, we divided the comments into two categories. The first category consists of comments from the first lockdown and the second category contains comments from the second lockdown.
Looking at both categories (Figure 1), the graphs both show a higher negative sentiment. The average negative sentiment score increased from 1,7547 to 1,9692. The average positive score decreased from 1,6016 to 1,5223. This may indicate that people had a more negative attitude towards the videos from the second lockdown versus the first.
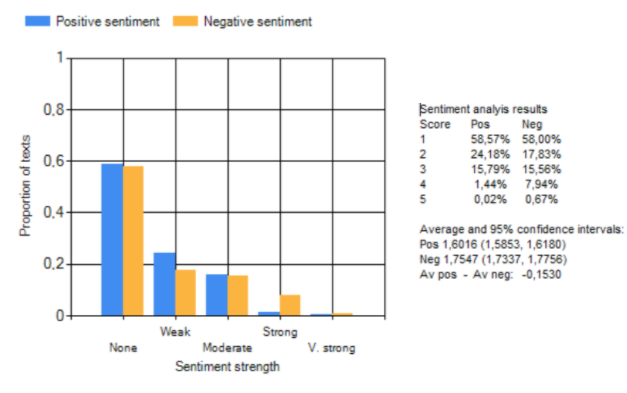
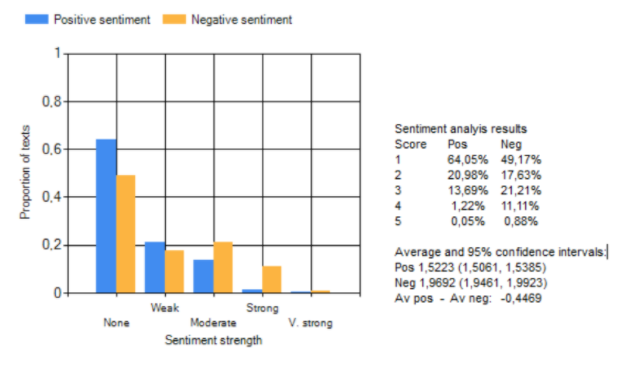
Figure 1. Comparison between the first and second lockdown.
We did the same with all relevant keywords to see if there were some changes in attitudes towards the UK government. We divided the keywords into four groups: government, measures, attitudes, and remaining keywords. The difference between the average positive and negative score are shown in the tables below.
Keywords related to the government
This group consists of the keywords government, Boris Johnson, and Prime Minister. Overall, sentiment relating to these keywords worsened during the second lockdown. Negative sentiment outweighed positive in all analysis, except for that of “Prime Minister” during the first lockdown, where the average negative and average positive scores are equal.
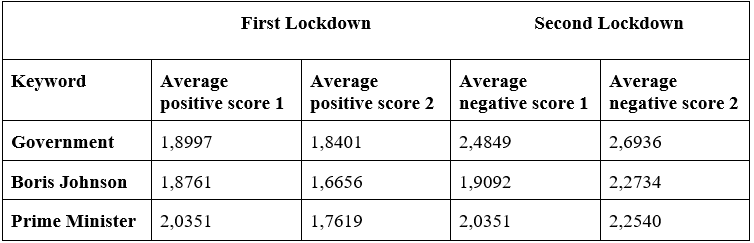
Table 1. Overview sentiment strength.
Comments containing the keyword government showed a rise in the average negative score from 2,4849 to 2,6936. At the same time, the average positive score dropped from 1,8997 to 1,8401. While more comments expressed no positivity, the numbers show a slightly higher percentage of comments with strong positive sentiment. However it was not enough to change the general trend, indicating commenters’ disapproval of the British government’s decision to enter a second lockdown.
The name Boris Johnson was frequently used in comments. The average negative score increased from 19092 to 2,2734. The average positive score decreased from 1,8761 to 1,6656. This may indicate that people’s attitude towards Boris Johnson shifted between the lockdowns.
Keywords related to measures
This group consists of the keywords measures, lockdown, social distancing, and masks. The sentiment analysis of these measure-related keywords report an overall trend of more and stronger negative sentiment in the second lockdown. Although more positive sentiment was expressed towards social distancing and measures, they were not popular enough among commenters to change the public’s general
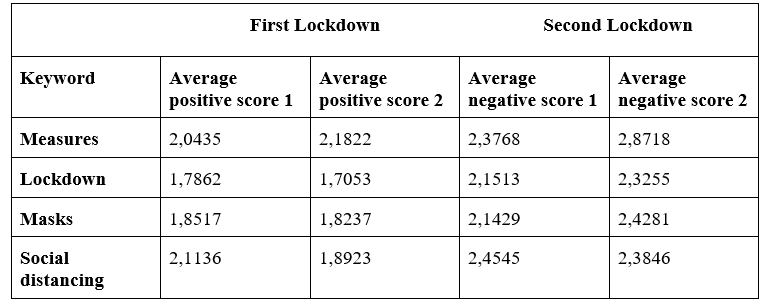
Table 2. Overview sentiment strength.
Regarding measures, comments containing the keyword measures showed a rise in average negative score from 2,3768 to 2,8718. The average positive score rose as well, from 2,0435 to 2,1822. While strong sentiment was predominantly negative in both lockdowns, the proportional difference between two sentiment types was wider in the second. Further examination is needed to provide more insight into changes in commenters’ feelings towards COVID-19 preventative measures.
People’s attitude towards lockdown became more negative as they had to enter another period of strict isolation. The average negative score rose from 2,1513 to 2,3255. Meanwhile, positivity in the comments slightly decreased, as it was expressed less often and less strongly. This led to a decrease of the average positive score from 1,7862 to 1,7053. This shows that the commenters were less supportive of the second lockdown.
Keywords related to attitudes
This group consists of the keywords: propaganda, conspiracy, school, control, freedom, and stay safe. These keywords showed an overall trend of more frequent and stronger negative sentiment during the second lockdown, with the exception of school and conspiracy. More positive sentiment was expressed towards freedom, propaganda and stay safe
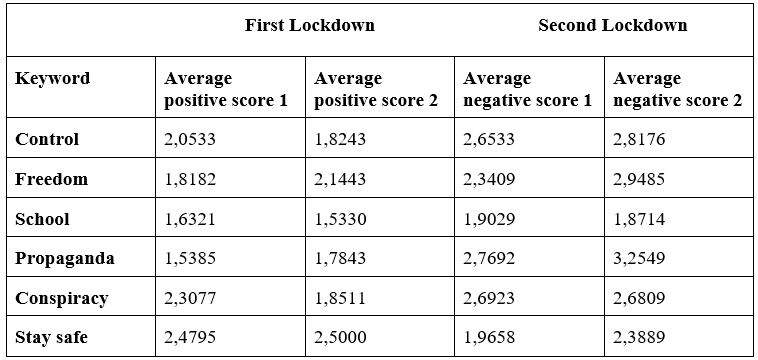
Table 3. Overview sentiment strength.
The average negative score of comments containing the keyword propaganda rose from 2,7692 to 3,2549, while the average positive score rose from 1,5835 to 1,7843. This may indicate that commenters did not take the media or government seriously. The keyword conspiracy saw a similar trend. Conspiracy was mentioned more often during the second lockdown, and its average negative score decreased slightly from 2,6923 to 2,6809. The average positive score also decreased from 2,3077 to 1,8511. This may indicate that people became more likely to relate the virus to conspiracy theories.
The keyword school showed more negative than positive sentiment during both lockdowns. Comments containing the keyword school showed a higher average negative and average positive score in the first lockdown, with the average negative score dropping from 1,9029 to 1,8714 and the average positive score dropping from 1,6321 to 1,5330. The only significant difference found was among comments showing moderate sentiments, which in the first lockdown had the same percentage of positivity and negativity, and in the second expressed more negative sentiments.
Remaining keywords
This group consists of the remaining keywords: vaccine, and all keywords referring to the virus, i.e., virus, Coronavirus, Covid, COVID-19, and Corona. The sentiment analysis of these keywords showed an overall trend towards stronger negative sentiment in the second lockdown.
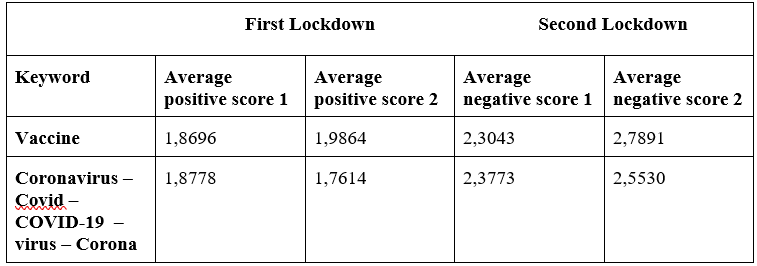
Table 4. Overview sentiment strength.
We used the keywords Coronavirus, Corona, virus, Covid and COVID-19 together in order to examine whether these comments had a more positive or negative sentiment towards the virus. The average negative score for comments containing these keywords rose from 2,3773 to 2,5530 and the average positive score decreased from 1,8778 to 1,7614. These scores may indicate that people had a more negative attitude towards the virus during the second lockdown in comparison to the first.
Association mining
Following the sentiment analysis, we used the same keywords for association mining. Association mining detects commonly mentioned topics and terms associated with specific keywords. We analyzed the associated, meaningful terms of high significance for each keyword. Just as with the sentiment analysis, we grouped the keywords into the categories government, measures, attitude, and remaining keywords.
Keywords related to government
We first examined the association mining for the keyword government. During the first lockdown, the most popular meaningful associated terms were related to public health and money. There was concern over the role of the government in taking measures to protect public health. How the government spent money on protective measures was questioned. In the second lockdown, the selected videos saw an increase in the use of the words that are related to the lockdown and deaths.
Second, we looked at the association mining for the keyword Boris Johnson. In the first lockdown, Boris Johnson is associated with words that refer to formal politics such as conservative and election. Another highly associated word was school, with people commenting to question why schools were still open. Words associated with Boris Johnson in the second lockdown refer to his leadership, like leader and Trump. In addition, people frequently used the words puppet and hair to make fun of him.
Lastly, we examined the association mining for the keyword Prime minister. In the first lockdown, Prime minister is associated with words that refer to him personally, such as ‘communist’ and ‘enemy’. Comments on videos from the first lockdown specifically noted that the prime minister was very late in announcing measures for the UK. Others expressed people’s disbelief that Johnson was still their prime minister.
On the other hand, some people commented more positively, with words like ‘good speech’ and ‘good job’. In the second lockdown videos, most associated words refer to how the public sees the Prime minister, such as ‘brainless’, ‘leader’ and ‘hero’.
Keywords related to measures
In this category, we first looked at the association mining for the keyword measures. In the first lockdown, measures are often related to the government, lockdown, schools and Boris Johnson. Commenters called for measures from the government or Boris Johnson to prevent the virus from spreading. They compared measures applied in the UK with those in Italy, complaining that people traveling back from Italy were not tested. Some commenters also lamented that the preventative measures would only be drastic enough when schools were closed.
During the second lockdown, many meaningful terms associated with measures are of high significance. They refer to the other keywords such as lockdown, government, and control. People questioned the efficacy of the measures, demanding factual information and statistics. Because of this, some protested the second lockdown and called for an alternative, such as social distancing.
Second, we looked at the association mining for the keyword school. In the first lockdown, there were not many significant or meaningful words related to school. The most popular comments refer to schools closing, with significant words including ‘shut’, ‘open’, and ‘spread’. Popular associated words were similar for the second lockdown. The dominant discussion was similar to that of the first lockdown, namely whether schools should be closed.
Association mining for the keywords lockdown and masks did not independently reveal pertinent results. However, lockdown was frequently mentioned in association with other keywords discussed earlier. The most meaningful associated words for masks were not mentioned frequently and most were related to mask wearing and personal hygiene.
Lastly, we looked at the association mining for the keyword social distancing. In the first lockdown, social distancing is associated with the words that refer to COVID-19 measures and guidance. In the second lockdown, social distancing is associated with words that refer to other measures such as mask and school. Some people spoke about social distancing in the context of schools, where students were not wearing masks or keeping distance from each other.
Keywords related to attitude
For this category we first looked at the association mining for the keyword control. In the first lockdown, control is often associated with the words ‘government’, ‘China’, ‘vaccine’, and ‘economy’. Commenters discussed the government’s control over the virus and expressed concern about the economy and vaccination efforts. China was discussed as having their local situation under control and also defended as not being the virus’ place of origin.
In the second lockdown, control is often associated with the words ‘virus’, ‘government’, ‘fear’ and ‘freedom’. Commenters strongly expressed that government measures to control the virus were actually attempts to restrict personal freedom. Comments referring to ‘control’ and ‘freedom’ appeared more frequently in the second lockdown.
Second, we look at the associated words for the keyword freedom. In the first lockdown, we see that commenters discussed a variety of issues in relation to freedom, as no associated term appeared in more than 25% of comments that included freedom. Popular associated terms were related to the government and authorities. As authorities imposed the lockdown, people lost their freedom of movement, which commenters argued was against the law.
Comments on the videos from the second lockdown often mentioned freedom in conjunction with other keywords such as government and control. These comments expressed growing concern over the power of the state/government to restrict millions of people’s freedom. It was emphasized that people had the right to make decisions for themselves. People also accused the government of lying about the efficacy of lockdown.
Third, the keyword propaganda was mentioned infrequently and mostly in relation to the government and the BBC. In the first lockdown, the word propaganda is strongly associated with ‘warfare’, ‘freedom’ ‘BBC’ and ‘information’. Propaganda was seen more often in comments on second lockdown videos. The associated words also referred to the media, BBC and government. People stated that the government and the mainstream media (BBC) were lying to them, or that they have no freedom and the coronavirus is a ‘joke’.
Fourth, we looked at the association mining for the keyword conspiracy. In the first lockdown, conspiracy is associated with the words ‘theory’, ‘network’, ‘hero’, ‘coverage’ ‘war’ and ‘ridiculous’. Some said that they did not believe in conspiracy theories, while others questioned if the virus itself was some sort of conspiracy theory. In the second lockdown there was more discussion of conspiracy theories, but the majority of the people mocked conspiracy theorists.
In many comments people used the sentence: “stay safe everyone”.
Lastly, the final keyword combination in this category is stay safe. In the first lockdown these words had a strong association with the word ‘everyone’, i.e. the sentence ‘stay safe everyone’, especially at the end of the comment. Stay safe was used similarly in the second lockdown, although far less frequently.
Remaining keywords
In the final category, the keyword vaccine was often associated with the pandemic and the media. Some used the word to encourage others to not take the vaccine, while others hoped that a vaccine would be soon available. In the second lockdown, vaccine is associated with the words ‘DNA’ and ‘control’.
Finally, we looked associations with the words used to refer to the virus (Coronavirus – Covid – COVID-19 – virus – Corona). In the first lockdown the word ‘China’ was mentioned many times in relation to these terms. Some commenters blamed China for the virus’ spread, while others simply discussed how China was handling the virus.
The name John Campbell was also mentioned by people refering to a YouTube video in which he summarizes a plan of action that the UK should have taken to tackle the virus. Other words associated with the virus are related to the illness, the government, and the media. In the second lockdown, the associated words also included ‘government’, ‘media’, and ‘school’, as well as ‘suicide’ and ‘propaganda’.
Digital ethnography
In this study, the research field consisted of the YouTube comments section and surrounding digital environment of the six selected YouTube videos. YouTube is an online video platform with millions of users. To start our digital ethnographic analysis, we investigated the ‘infrastructure’ (Blommaert 2019) of the platform. We studied YouTube’s affordances, as these impact the actions users are able to take on the platform. Since our research subjects are people who commented on the BBC and BBC News COVID-19 videos, we focused on the affordances YouTube offers for people who watch videos. Hereafter we discuss all affordances YouTube has to offer, after which we discuss the rest of our findings.
Digital affordances
First of all, users can like and dislike a video. This means that they can easily express their feelings towards a video by clicking the ‘thumbs up’ or ‘thumbs down’ button. YouTube shows the number of likes and dislikes directly underneath the video. Further people have the ability to comment on a video and on others’ comments; the comments section has elaborate digital affordances.
Firstly, people can comment both words and emojis. Secondly, the comments section gives people the option to like or dislike other people’s comments via thumbs up and thumbs down buttons. Third, users can respond to other users’ comments. In a subsection of commenters responding to each other, YouTube gives the option to use @’username’ to directly respond to someone else’s comment in the subsection. Fourth, YouTube supports the use of hashtags in the comments. Finally, people can insert timestamps in their comments, for example 0:22, to create a hyperlink to that specific point in the video. The comments section thus offers users a lot of options.
Looking at the digital affordances, we saw one notable difference between videos from the first lockdown and videos from the second.
YouTube further allows users to share or save a video, report a comment or video, and subscribe to ‘channels’. However, which and whether people use these affordances is not publicly visible. In this research we therefore focused on the affordances of the comments section and likes and dislikes on the videos. The videos used in this analysis were uploaded to the BBC and BBC News YouTube channels. Both channels post several videos daily; however, BBC News mainly focuses on global news, while BBC focuses on news and entertainment. Nevertheless, both channels have a large platform - 8.98 and 10.3 million subscribers, respectively.
We saw one notable difference between videos from the first lockdown and videos from the second: the number of likes and dislikes each video received. It is important to note that the number of likes and dislikes for all videos was relatively high compared to the number of views each video had. Videos from the first lockdown clearly received more likes than dislikes. However, for the second lockdown videos, each received more dislikes than likes. This difference shows a negative change in sentiment between the first and the second lockdown.
People actively engaged with the comments section of videos from both lockdowns. However, despite the shift in the number of likes and dislikes on the videos themselves, there was no clear difference between likes and dislikes left on users’ comments. Among the most popular comments – and in general – there were little to no dislikes. In contrast, popular comments had many likes. Comments with the most likes are pushed to the top of the comment section as a ‘top comment’. Therefore, liking a comment on YouTube appears to be normalized, unlike disliking.
Thus, even though disliking a comment is an action enabled by YouTube’s ‘infrastructure’, people do not seem to use it. This might therefore be an example of ‘moralization’ or the negotiation of (online) norms (Blommaert, 2019). Image 1 shows that the digital affordances of commenting on the video, responding to comments, and liking comments occur frequently, but disliking someone’s comment is nearly non-existent.
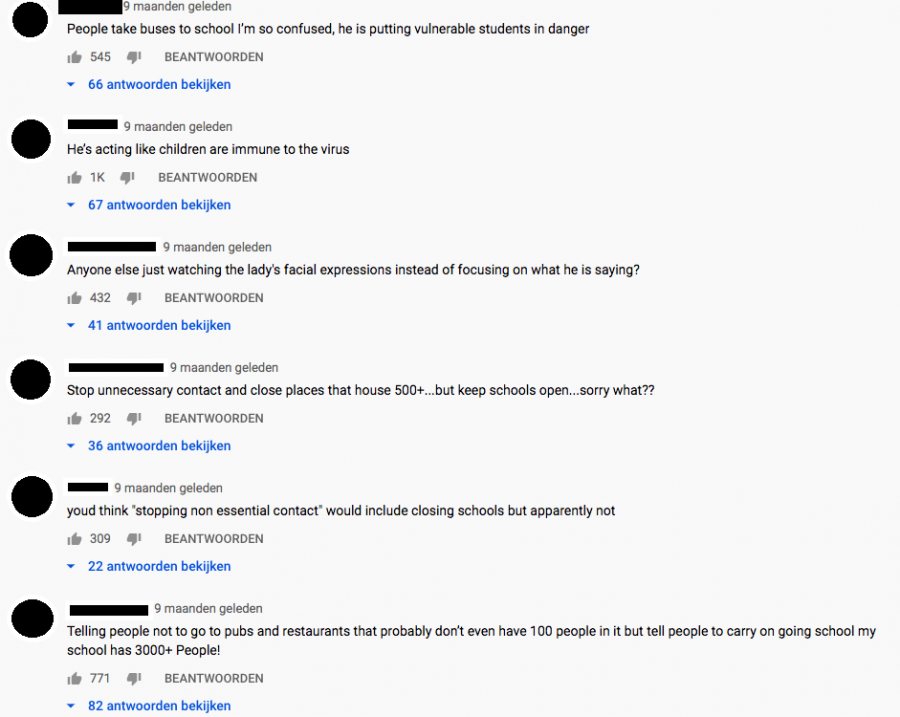
Image 1: Comments on video 1 of lockdown 1.
Semiotic resources
Our analysis also focused on semiotics. One notable sociolinguistic feature was the use of capitalization, often supported by many exclamation marks or question marks. These comments typically express negativity towards people in or the topics of a video, and capitalization and exclamation marks are used to express urgency.
These sociolinguistic features were mainly found in comments that were aggressive towards the announced measures or the government. For example, a comment from a lockdown two video reads: “PRIME MINISTER IS ‘SUSPECT’ DOES ANYONE TRUST THAT LUCIFERIAN??”. Another example of such a comment can be seen in Image 2. There was no notable difference found between the first and second lockdown regarding these specific sociolinguistic features.
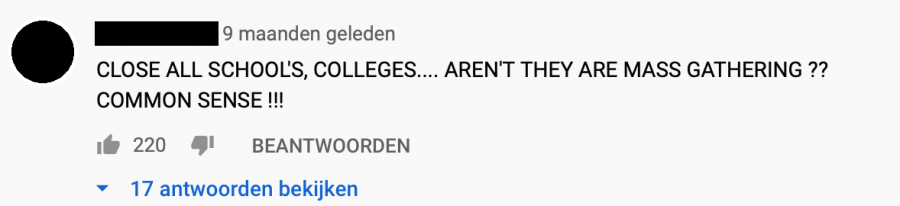
Image 2: Comment on video 1 of lockdown 1.
Emojis and hashtags, although common online, were rarely used in the comments section of the selected videos. Emojis were almost always used in reply to another user and always in a positive way. During the first lockdown, British people as well as people from all over the world wrote compassionate and supportive comments. These messages often included emojis like country flags, hearts, and ‘prayer’ hands. However, overall there was very little use of emojis or hashtags.
Although very few were used, there was a visible change in hashtags between the first and second lockdown. In the first lockdown, hashtags like #stayhome, #coronavirus, and #borisjohnson are used. During the second lockdown hashtags like #thegreatreset, #defundthebbc, and #covidbrain were used. These hashtags are more conspiracy-based, alluding to the belief that COVID-19 was engineered for depopulation or that the public media is spreading misinformation. The first and second lockdowns had no shared popular hashtags.
The comments also featured several textual memes. One type of textual meme present in videos from both lockdowns are ‘comparison’ memes. This meme portrays a comparison between two things or people; we have included some examples in Image 3 and 4. As the examples show, some textual comparison memes are meant to be humorous, while others were used to highlight users’ dissatisfaction or disagreement.
The use of textual memes demonstrates the importance of our ethnographic analysis, as sentiment analysis would not consider a comment like the meme in Image 3 to be negative, since there is no negative wording. A qualitative perspective allows for nuance and contextual understanding.
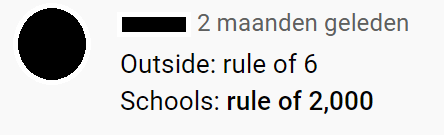
Image 3: Comment on video 1 lockdown 2.
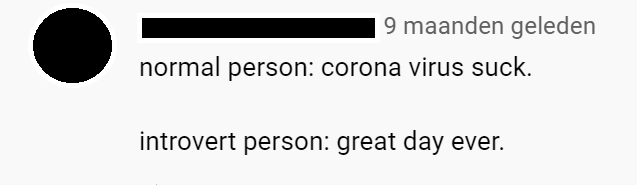
Image 4: Comment on video 2 lockdown 1.
In addition to memes, there were sarcastic comments about spreading the virus, which in the sentiment analysis could have been assessed as positive – because they include positive wording – but are actually very negative. These sarcastic comments were more present during the second lockdown and were more often part of the top comments. One example of a ‘regular’ sarcastic comment can be seen in Image 5. Someone is saying that the virus is smart, but this is not meant in a positive way, which the word ‘smart’ would imply. The commenter is actually being critical of not including schools in the lockdown.
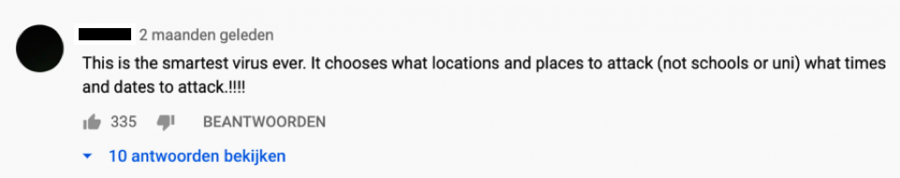
Image 5: Comment on video 1 of lockdown 2.
Furthermore, there were many comments in which people quoted Boris Johnson’s speech. This was primarily done to show disagreement with him or even show how the measures contradict each other. One example be seen in Image 6: the user is quoting Johnson’s speech, saying one can only trick or treat with six children. They then replies to this statement by pointing out that children are still allowed to go to school with thirty children in one classroom, showing the contradiction between the two measures.
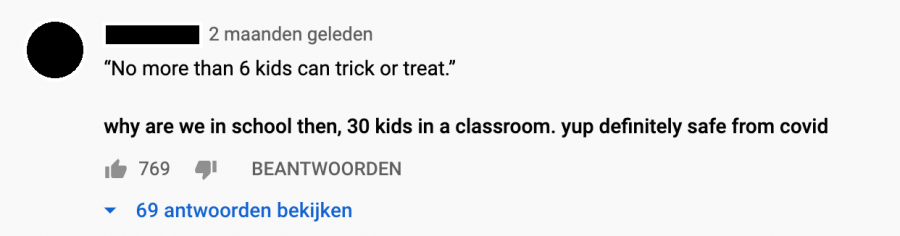
Image 6: Comment on video 1 of lockdown 2.
Most mentioned topics
As an extension of the association mining in phase one of this research, we also examined popular topics within the comments sections. In the first lockdown comments, people are mostly wishing each other well or disagreeing with the measures. The measure many people disagreed with was schools remaining open when everything else was in complete lockdown. This was also clear in the association mining, which showed that terms like ‘shut’ and ‘open’ were associated with school. It was later decided to close all schools during the first lockdown. There were also concerns about homeless people, as they cannot stay ‘at home’.
Although most top comments had a negative touch to them, there are also some positive comments, for example about Boris Johnson’s speech and encouraging everyone to stay safe. This relative positivity about Boris Johnson was also found with association mining, as general words like ‘conservative’ and ‘election’ were found to highly associate with Boris Johnson. However, these comments were predominantly from March 2020, when the first lockdown started. Comments from December 2020 were all negative, either calling Boris Johnson a liar or saying that they are not any better off now than they were during the first lockdown.
Negative sentiment was most often expressed in comments about schools remaining open.
Whereas there was some positivity in comments from the first lockdown, comments from the second lockdown were overwhelmingly negative. Commenters disagreed with the both the measures themselves, as the situation did not seem to be improving, and the amount of control they felt the government had taken. This finding is in line with the association mining, which showed that during the second lockdown the terms ‘control’ and ‘freedom’ were more frequently used and more strongly associated with each other.
Similar to the first lockdown, most people disapproved of the schools staying open. This reinforces findings from the association mining, which also showed that terms associated with ‘school’ remained the same over the first and second lockdown. Again, these negative comments get the most likes and responses.
Others disapproved of the lockdown not immediately going into effect. The press conference took place on October 31st, 2020, but the lockdown only started on November 5th, 2020. Whereas there were some positive comments about Boris Johnson during the first lockdown, this had completely faded by the second lockdown. This matches the association mining for the term Boris Johnson; during the first lockdown Boris Johnson was associated mostly with general words (e.g. ‘conservative’, ‘election’), however, during the second lockdown Boris Johnson was associated mostly with terms with a negative connotation, like ‘leader’ and ‘Trump’.
Furthermore the BBC and other media were questioned, unlike during the first lockdown, with more commenters asserting that the media is spreading misinformation. However, as with the first lockdown, people were not negative towards each other. There is almost no discussion in the comments section, most commenters demonstrated agreement with each other. Overall there seemed to be more negative sentiment than positive sentiment during both lockdowns. The negative sentiment was most often expressed in comments about schools remaining open.
Limitations
These finding demonstrates the importance of a mixed-methods approach. For example, while big data analysis did find an overall more negative sentiment for the keyword ‘school’, the numbers are not as shocking as one would assume from the ethnographic analysis. Mozdeh measures sentiment based on word use, which is apparently more negative than positive and may explain this gap.
However, Mozdeh has some shortcomings. First, it cannot ‘read through’ sarcasm and cannot understand textual memes. Second, Mozdeh does not take into account the number of likes and responses a certain comment gets. Comments that spoke negatively about the government’s measures regarding schools prevailed in almost all videos. These comments by far received the most likes and agreeing comments, a point that adds significantly to our understanding of users’ response to these videos.
Discussion and conclusion
The current study aimed to answer the following research question: How have UK citizens' attitudes towards the government changed over the course of the first and second lockdown, due to the COVID-19 measures? This research question was answered using ethnomining, a mixed-method design combining data mining and (digital) ethnography. The dataset used for this study consisted of the comments left on three videos about the first lockdown and three about the second lockdown on the BBC and BBC News YouTube channels.
We first used data mining to examine whether there was a change in attitude towards the government between the first and second lockdowns. This analysis consisted of sentiment analysis and association mining. Digital ethnography was then used to clarify this change in attitude, with an emphasis on digital affordances, semiotics, and the most mentioned topics.
Data mining showed that there was a visible change in attitude between the first and the second lockdown. Sentiment analysis showed that in general, the comments examined had a higher negative sentiment than a positive sentiment. Negative sentiment increased between the first and the second lockdown, indicating that UK citizens’ attitudes became more negative over time. For almost all keywords the negative sentiment was higher in the second lockdown. Specifically there was a visible change in attitudes towards Boris Johnson and among keywords related to the government. Comments in the first lockdown were more positive towards Johnson.
Keywords related to the COVID measures showed an increased negative sentiment in the second lockdown, in particular lockdown and mask. It appears that people were not as supportive of the second lockdown. However, social distancing received a less negative sentiment in the second lockdown. This could imply that people preferred social distancing to a full lockdown.
With regard to keywords about attitudes, the most notable outcome is that conspiracy and propaganda were mentioned much more during the second lockdown. This also implies a shift in attitude. People took the media and government less seriously compared to the first lockdown.
Among the remaining keywords, people more frequently mentioned the word vaccine in the second lockdown. Moreover, all keywords referring to the virus had a slightly stronger negative sentiment in the second lockdown. To conclude, data mining revealed a notable change in attitude between the first and second lockdown. Overall, British people had a more negative attitude towards the government, their decision-making, and the media during the second lockdown.
Digital ethnography confirmed a more negative general attitude during the second lockdown. The likes and dislikes on each videos showed a negative shift in sentiment between the first and second lockdowns. Videos from the first lockdown received more likes than dislikes, while videos from the second lockdown received more dislikes than likes.
The comments examined often made use of sociolinguistic features such as capitalized letters, question marks, and exclamation marks. These were most often used to express negative emotions. However, there was no notable difference in the use of these between the first and second lockdown.
Confirming our association mining findings, our ethnographic analysis found a slight change in the topics mentioned between the first lockdown and second lockdown. During the first lockdown there were still some positive comments about staying safe or how well Boris Johnson delivered his speech. However, in the second lockdown there were almost no positive comments. Most commenters disagreed with the new lockdown measures and expressed distrust in the government and media.
However, there was one topic frequently mentioned in both lockdowns: school. During both lockdowns commenters were very negative about schools remaining open during lockdown. Big data analysis also showed slightly more negative than positive sentiment in comments about schools, however digital ethnography revealed the extent of this negativity. An explanation for this is that many negative comments contained sarcasm and jokes. Because the wording in these comments was positive, the software did not detect them as having negative sentiment.
To conclude, there seems to be an overall negative sentiment towards the government and the virus during both lockdowns. While commenters still expressed some hope and positivity during the first lockdown, this completely shifted during the second lockdown.
Limitations
This study has several limitations that deserve further explanation. The first is a lack of demographic information about the people behind the comments examined. As our research question was concerned with attitude changes among UK citizens towards their government, we chose to analyze comments left on the British press conferences. We assumed a predominantly British audience would watch these videos and leave comments. However, this estimate cannot be validated, as not all YouTube accounts contain demographic information and people from all over the world are able to watch and comment on these videos. Nevertheless, we assumed that mainly UK citizens would watch these videos and leave comments as the information discussed impacts their country and thus their lives.
The second limitation of this study is that the results cannot be generalized to all UK citizens. Firstly, not every UK citizen uses YouTube, and those who do might not watch news or press conferences - one can find the discussed information elsewhere (TV, radio, in newspapers). Secondly, not every viewer leaves comments. So, only a small percentage of UK citizens are represented in this study. Hence, findings of this study cannot be generalized for the UK population as a whole; they only represent YouTube-users who comment on videos or use other digital affordances (e.g. (dis)liking videos and/or comments). Nevertheless this study offers insight into this specific group, which is a first step to studying this topic on a more comprehensive scale.
Despite the limitations of this study, we believe that our conclusions are the result of valid and reliable information, but that the limitations should be kept in mind when interpreting the information.
Directions for further research
The results of this research prompt several new questions, namely precisely whose attitude towards the government changed? This information could not be gathered through this study’s methods as YouTube does not publicly offer demographic information on its users. Therefore, other methods like interviewing could offer more contextual information about commenters.
Network analysis in Mozdeh or other big data software might also offer useful insights. Network analysis would show the network that specific commenters have built on YouTube, which may help to see if there is a certain ‘online community’ underlying negative attitudes towards the government. Another interesting direction for further research would be whether this negative change in attitude also occurred on other online platforms like Twitter or Reddit.
References
Aipperspach, R., Rattenbury, T. L., Woodruff, A., Anderson, K., Canny, J. F., & Aoki, P. (2006). Ethno-mining: integrating numbers and words from the ground up. Electrical Engineering and Computer Sciences University of California at Berkeley Tech Report UCB/EECS-2006, 125.
Asimakopoulou, K., Hoorens, V., Speed, E., Coulson, N. S., Antoniszczak, D., Collyer, F., Deschrijver, E., Dubbin, L., Faulks, D., Forsyth, R., Goltsi, V., Harsløf, I., Larsen, K., Manaras, I., Olczak‐Kowalczyk, D., Willis, K., Xenou, T., & Scambler, S. (2020). Comparative optimism about infection and recovery from COVID‐19; Implications for adherence with lockdown advice. Health Expectations, 23(6), 1502–1511.
Blommaert, J. (2019). From groups to actions and back in online-offline sociolinguistics. Multilingua, 38(4), 485-493.
Chik, A., Hafner, C. A. & Jones, R. H. (Eds.). (2015). Discourse and digital practices: Doing discourse analysis in the digital age. Routledge.
Creswell, J. W., Plano Clark, V. L., Gutmann, M. L., & Hanson, W. E. (2003). Advanced mixed methods research designs. Handbook of mixed methods in social and behavioral research, 209(240), 209-240.
Creswell, J. W. (2009). Research Design: Qualitative, Quantitative, and Mixed Methods Approaches. SAGE Publications.
Duffy, B. (2020). Life under lockdown: coronavirus in the UK. Policy Institute, KCL.
Fancourt, D., Steptoe, A., Wright, L. (2020, August 6). The Cummings effect: politics, trust, and behaviours during the COVID-19 pandemic. The Lancet, 396, 464-465.
Fletcher, R., Kalogeropoulos, A., Nielsen, R.K. (2020, June 1). Trust in UK Government and News Media COVID-19 Information Down, Concerns Over Misinformation from Government and Politicians Up. Reuters Institute for the Study of Journalism.
Hine, C. (2015). Ethnography for the internet: Embedded, embodied and everyday. Bloomsbury Publishing.
Iacobucci, G. (2020). Covid-19: UK lockdown is “crucial” to saving lives, say doctors and scientists. BMJ, 368.
Maher, P. J., MacCarron, P., & Quayle, M. (2020). Mapping public health responses with attitude networks: the emergence of opinion‐based groups in the UK’s early COVID‐19 response phase. British Journal of Social Psychology, 59(3), 641-652.
Marchal, N. & Au, H. (2020). “Coronavirus EXPLAINED”: YouTube, COVID-19, and the Socio-Technical Mediation of Expertise. SAGE Journals.
Peto, J., Alwan, N. A., Godfrey, K. M., Burgess, R. A., Hunter, D. J., Riboli, E., Romer, P., Buchan, I., Colbourn, T., Costelloe, C., Davey Smith, G., Elliott, P., Ezzati, M., Gilbert, R., Gilthorpe, M. S., Foy, R., Houlston, R., Inskip, H., Lawlor, D. A., … Yao, G. L. (2020). Universal weekly testing as the UK COVID-19 lockdown exit strategy. The Lancet, 395(10234), 1420–1421.
Puschmann, C., & Powell, A. (2018). Turning words into consumer preferences: How sentiment analysis is framed in research and the news media. Social Media+Society, 4(3)
Thelwall, M. (2018a). Social web text analytics with Mozdeh.
Thelwall, M. (2018b). Social media analytics for YouTube comments: Potential and limitations. International Journal of Social Research Methodology, 21(3), 303-316.
Thelwall, M. (2020, September 18). SMDA 5 YouTube analysis with Mozdeh [video]. YouTube.
Thelwall, M., & Thelwall, S. (2020). A thematic analysis of highly retweeted early COVID-19 tweets: Consensus, information, dissent and lockdown life. Aslib Journal of Information Management, 72(6), 945–962.
Varis, P. (2016). Digital ethnography. In A. Georgakopoulou & T. Spilioti, The Routledge Handbook of Language and Digital Communication (pp. 55-68). Routledge.
Varis, P. (2014). Digital ethnography. Tilburg Papers in Culture Studies, 104.
White, R. G., & Van Der Boor, C. (2020). Impact of the COVID-19 pandemic and initial period of lockdown on the mental health and well-being of adults in the UK. BJPsych Open, 6(5), e90.
Appendix
Appendix A: The Dataset
First Lockdown (23 March 2020)
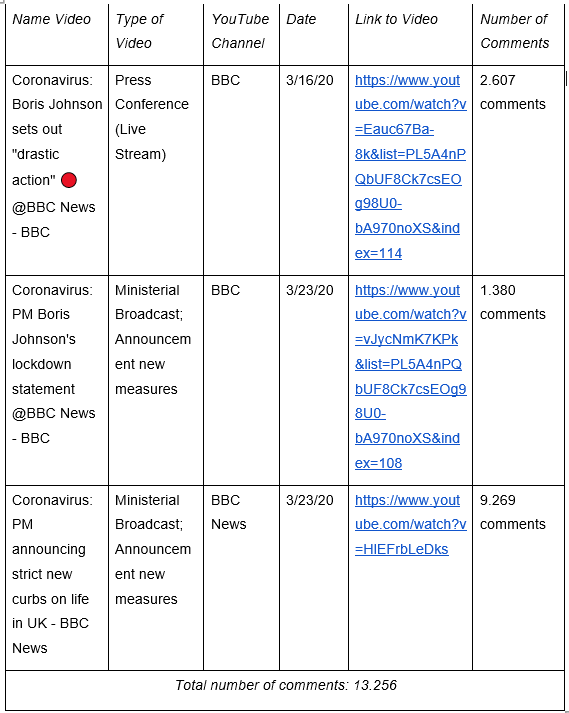
Table 5. Dataset first lockdown.
Second Lockdown (5 November 2020)
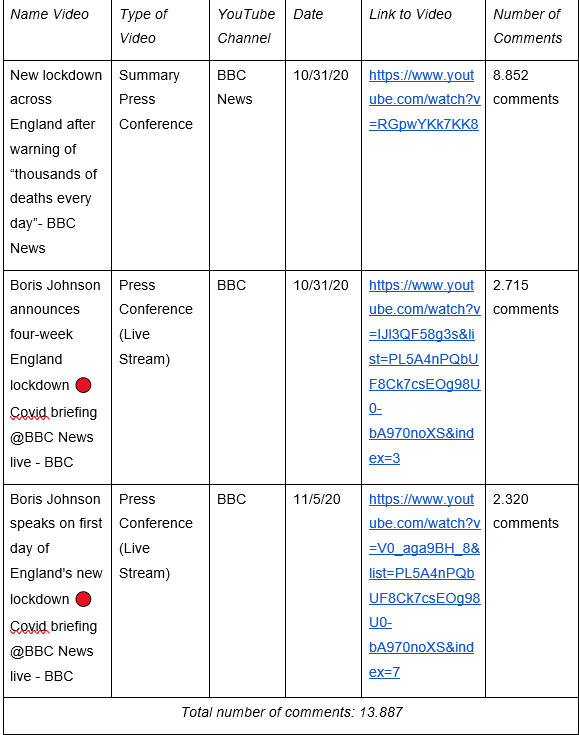
Table 6. Dataset second lockdown.