
Google Maps' commercially oriented representation of the world
Maps are generally seen as neutral tools that can be used to transfer objective information. However, though maps are often used to present objective information, they are not just neutral conveyers of that information. In fact, maps always represent the specific point of view of the map maker, which is inevitably influenced by commercial, ideological or political factors. This article explains the consequences of Google Maps' commercially oriented representation of the world.
Critical cartography
For a long time, the aim of the academic practice of cartography has officially been to display accurate depictions of the earth in the most objective way possible. Consequently, maps have generally gained the reputation of a neutral tool that can be used to visualize scientifically obtained information. However, since the 1980s, when scholars in the field of critical cartography started to critically analyze cartographic practices, it has been argued that the “objective” terms in which cartography operates are contingent on the social, historical and political contexts in which maps are produced and used.
Since then, the neutral and scientific image of maps has been a topic of debate. Instead of regarding maps as ontologically secure tools (and believing that the world can be objectively mapped by using scientific tools to capture and display spatial information), critical cartographers started to investigate the social, cultural and technical contexts that determine how and why are maps are produced and used (Crampton, 2003; Kitchin & Dodge, 2009).
The Mercator projection
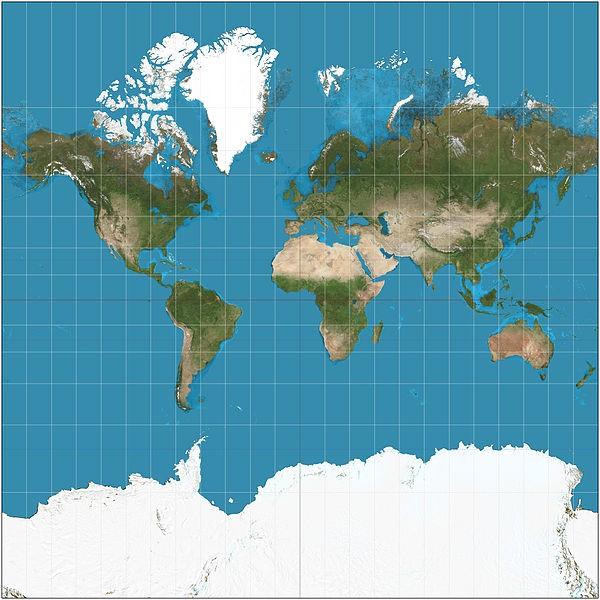
The Mercator projection, designed in the 16th century and still widely used.
Consider the famous Mercator projection, seen above. This map was designed in 1569 by the Flemish cartographer Gerardus Mercator to be used for nautical navigation and it still is one of the most widely displayed and used maps in the Western world (for example, it is the base map of Google Maps). Like any world map, it features distortions in the projection of land areas since it is difficult to represent the spherical reality of the world in relative proportions in a 2D format. In this map, the sizes of areas far from the equator are exaggerated in comparison to those of areas close to it. For instance, Greenland appears to be the same size as Africa, while in reality the continent of Africa is fourteen times bigger. Many scholars – and others – have criticized this projection for it does not simply “facilitate nautical navigation, but instead serves to reiterate colonial domination by demonstrating the centrality and global importance of Europe” (Harpold as quoted by Farman, 2010, p. 871).
Google’s representation of the world is focused on commercial interactions.
The Mercator projection was initially designed for navigational purposes, for which it still serves as a useful tool. However, it is not appropriate as a representational projection of the world due to the area distortions it depicts. Yet, when atlas and mapping platform designers apply this projection as their base map, for many people (at least the billions of Google Maps users and everyone who has used this map in a school atlas), this flawed projection serves as the “real” representation of the world. Thus, it is not so much the distorted areas that are the source of the problem – those do not interfere with the aim of the map: facilitating navigation – but rather, it is the context in which this map is used that is problematic. Despite its distortions, the map’s contextual framing presents it as a neutral conveyor of objective information.
Maps influence how we act
This has consequences as maps influence how users understand and perform in the represented space. Think, for instance, about the times you blindly followed the directions of your GPS device only to end up on a road which turned out to be inaccessible for cars. Another example of how consequential maps' representations are is seen in maps that raise or lower expectations about a landscape to be visited: “walking through an area demarcated as ‘wilderness’ on a map might elicit a more (or, indeed, a less) satisfying ‘nature’ experience as a result of expectations set by the map” (Harris & Hazen, 2009, p. 61).
In turn, this might influence patterns of mobility: “A tourist looking at [a ‘protected area’] map may consider seeking out such spaces to have a ‘wilderness experience,’ or indeed may avoid such areas assuming that there will be nothing of interest for them” (Harris & Hazen, 2009, p. 61). Maps influence a user’s movements, which in turn reaffirm the represented understanding of the space the map displays (Del Casino & Hanna 2000, 2006). This is similar to what happens when we follow the directions of our GPS device only to end up stuck in a narrow road, like the truck driver in the figure below: the map’s contextual framing – a usually reliable navigation device – made this choice seem ontologically secure.

The driver of this truck followed the directions of the GPS down a narrowing road until he got stuck at the end.
Google Maps
With more than five billion app downloads, Google Maps is the most widely used map for daily life navigational purposes worldwide. The app also hosts a participatory community of over 120 million users who actively contribute pictures, reviews and other information. Additionally, Google Maps is the most widely used mapping service for third parties; thousands of companies, including Uber, Booking.com and Takeaway.com, make use of Google’s map to provide their location-based services.
Like any map, Google Maps shows a partial perspective on the world. Invariably, the map-making motive coincides with the information that is displayed on the map: Google’s representation of the world is focused on commercial interactions. Consider the two representations of the city of Eindhoven seen below. The first is by Google Maps and the second by OpenStreetMap. The difference between the two becomes evident when one notes the most eye-catching aspects on Google Maps: the symbols and names indicating companies. Further, Google Maps depicts algorithmically generated highlighted areas which represent a high concentration of commercial activity. This representation corresponds with Google’s business model, which is based on gathering and selling user data and providing advertisement opportunities for other companies. The map is designed to fit this business strategy.
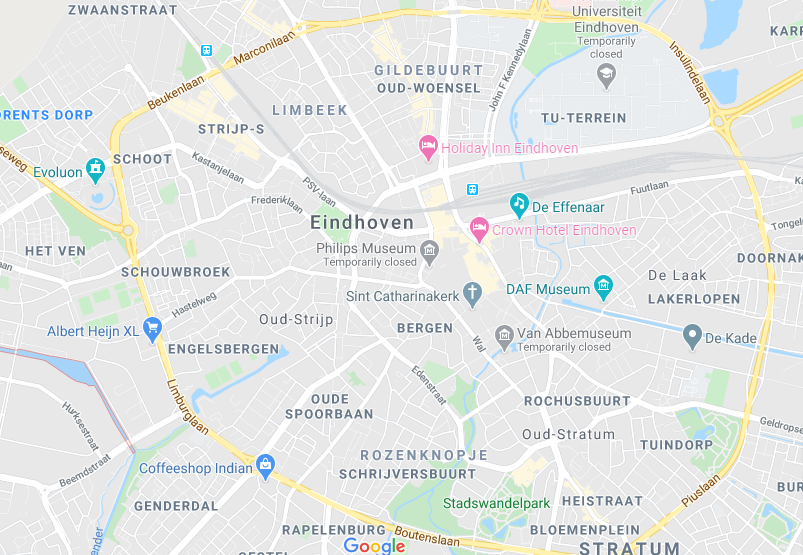
The city of Eindhoven as displayed on Google Maps.
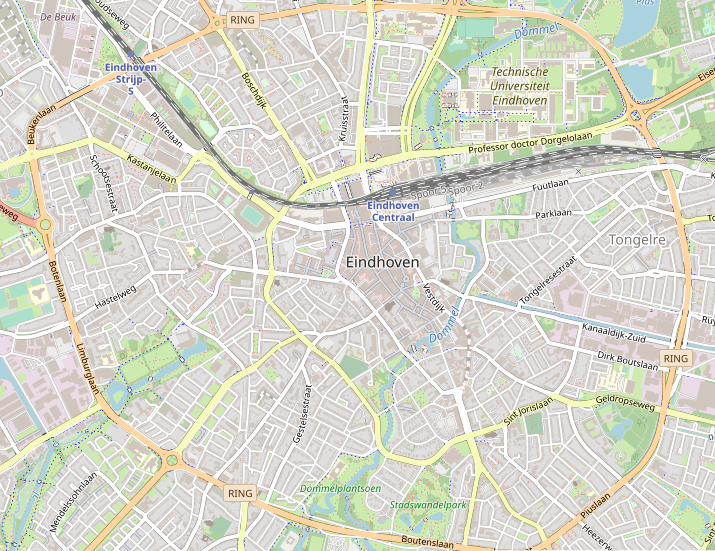
The city of Eindhoven as displayed on OpenStreetMap.
Google Maps and the Local Guides community
This commercial orientation is also prevalent in Google Maps’ participatory community. Users are invited to contribute their local knowledge to Google Maps by joining the Local Guides community. "Local knowledge" entails mainly information about companies and touristic areas displayed as reviews, pictures and videos, all in the context of updating “points of interest” with business or touristic information. Users receive benefits, such as special Local Guide badges (which also indicate their “level” on their personal page), extra (temporary) Google Drive storage, early access to new Google products and, if lucky, a special pair of socks for Christmas.
The Local Guides meet on the Local Guides Connect forum, a social networking platform moderated by Google employees. On this platform, they share their thoughts, pictures, ideals and suggestions; they also organize meet-ups and become friends. Further, Google hosts the annual Connect Live event. For this event, around 150 Local Guides are selected from thousands of applications to join an all-inclusive week in a hotel in the United States. The gamified rewarding system used for Local Guides is quantity-based: the more someone contributes the more merits they receive. As of 2020, more than 120 million Local Guides participate in the program.
Trusted Photographers
Users can also contribute to Google's map as Trusted Photographers. These contributors ought to invest 3,500 dollars in a specific kind of GPS-connected camera and use it to shoot 360° imagery for Street View or the interior of companies (this latter feature falls under the name of Virtual Tours). As a reward for these contributions, the photographers are granted the rights to profile themselves as a Google Trusted Photographer. Consequently, Trusted Photographers offer their services to companies that aim to improve their visibility on Google Maps. In Eindhoven, for example, a company providing photos for Google asks for a fee ranging from 225 to more than 525 euros for an interior shoot of 360° pictures.
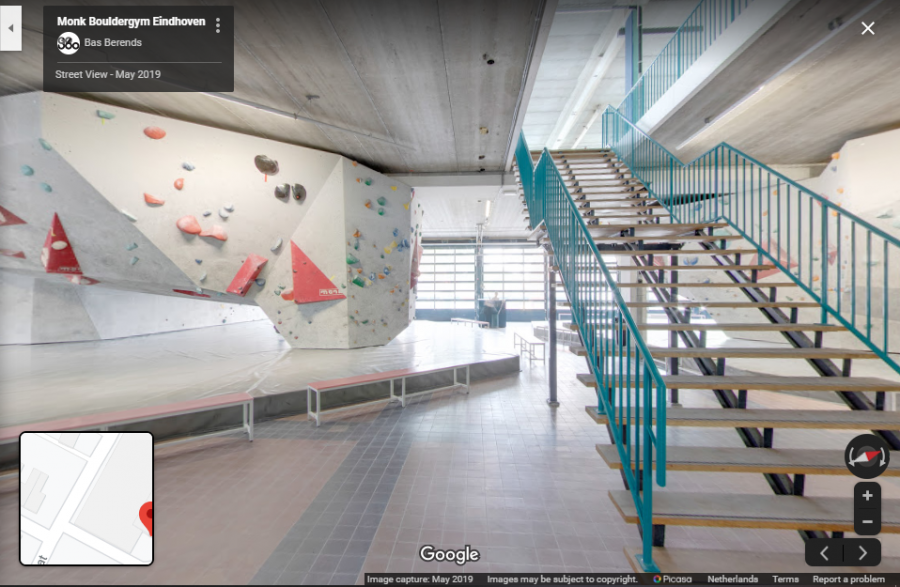
Screenshot of a Virtual Tour of a bouldering gym in Eindhoven.
Database maintenance
Although some Trusted Photographers have found a way to exploit this process of user participation themselves, it is not difficult to recognize the value it has for Google Maps itself. The input coming from user participation is recentralized around Google’s corporate interests: it is used both to enhance the accuracy of their map and to gather profitable user data. This has led Plantin (2018) to argue that in Google Maps, user participation is channeled to work as a form of database maintenance.
For example, because the uploaded Street View imagery is geo-located, it can be used to track the roads that the providers followed to check whether these roads correlate with the roads displayed in the map. Further, the images are analyzed by optical character recognition (OCR) software to recognize words and symbols such as road names and house numbers. This extracted information is used, for instance, to read road signs and improve route suggestions (Madrigal, 2012).
To verify the outcomes of the OCR analysis, the verification software of reCAPTCHA is used (McQuire 2019: 155). When stumbling upon a verification task, users must select the images which depict a certain subject, such as a store front, from a collection of Street View imagery. These selections are then used to improve the process of OCR analysis of Street View data.
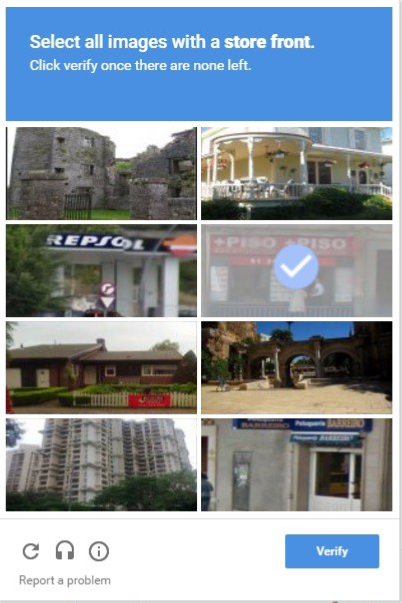
reCAPTCHA verification with Street View imagery.
Counter-mapping discourse
By using these kinds of methods, user participation is channeled not so much to create content, but rather to maintain Google's database (Plantin, 2018, p. 499). This is inconsistent with the kind of promotional language that is used to attract participants for these programs. Google frames its map in the Local Guides community as an empowering counter-mapping tool. Counter-mapping, which is related to the academic field of critical cartography, refers to the effort of mapping against dominant power structures with the aim of effectuating social or political change. See, for example, the Mapping Prejudice project, which maps real estate contracts with covenants that reserved land for the exclusive use of white people, in order to show how racial restrictions are embedded in the physical landscape.
Online invisibility is a problem created by Google Maps and other reviewing platforms like TripAdvisor and Yelp in the first place.
Google attracts Local Guides by generating and maintaining the idea that they are helping others. During the Connect Live event in 2019 a Google spokesperson mentioned that all the reviews and pictures uploaded by Local Guides had generated a total of 3.5 billion views. In other words, the Local Guides had helped others 3.5 billion times, because “helping” involves providing others with reviews and pictures so they can make “the best decisions about the things worth doing.”
Further, Local Guides are supposedly helping local businesses by improving their visibility on Google Maps. In a Local Guides recruiting video posted by Google Maps on YouTube, a Local Guide shows her dedication to adding reviews of local businesses run by women to promote them with the following motivation:
"My ultimate goal is to inspire women to follow their dreams. … I hope that by adding businesses on Google maps it will change the mindset to 'Yes, women can run businesses successfully, women are strong, inspiring.' Do whatever small thing you can do and together we can move mountains."
This video shows a clear example of how Local Guides are said to be helping others: they help both the businesses they review and the other map users who can then base their decisions on the information provided.
The problem of online invisibility
In the Local Guides community, Google Maps is framed as an empowering tool which can be used in creative and counter-hegemonic ways, for example to pursue feminist aims. However, the user-generated data is primarily used to maintain Google’s database, and not so much to support charitable goals. Although online visibility might increase revenues for small businesses, and the efforts of Local Guides may truly help those shop owners, online invisibility as a harmful prospect for businesses is a problem created by Google Maps and other reviewing platforms like TripAdvisor and Yelp in the first place.
By discursively constructing local businesses as invisible and Local Guides as empowered, Google’s financially-oriented mapping effort is framed as a means for socioeconomic inclusion.
The visibility of places on these platforms is determined by the amount of information, pictures, positive ratings and reviews about them that have been uploaded by users. And the information presented on these platforms influence other users' choices. Therefore, as Firth (2017) has argued, online invisibility can have very real effects on where people go. Uneven access to relevant websites due to limited internet access or digital illiteracy might cause an unequal representation of places. This renders the underrepresented parts of the city invisible online. Consequently, “the rich get richer, the poor get poorer” (Firth, 2017, p. 547). For (small) companies, online invisibility is a real problem, but this problem is created by the review-based platforms like Google Maps themselves.
Tech solutionism
By presenting the Local Guides program as a solution to this problem of online invisibility, Google demonstrates a strategy of tech solutionism. This strategy is also exposed by Luque-Ayala and Neves Maia (2019) in their research on a Google Maps mapping project in the favelas of Rio de Janeiro. The aim of the project Tá No Mapa (‘It’s on the Map’) was to enhance the socioeconomic inclusion of informal settlements by putting them on the digital map. By discursively constructing the favelas as “invisible” and “disconnected” from the rest of the city, Google Maps presented their mapping project as a way of providing visibility whilst helping to overcome systematic exclusions.
Local favela inhabitants were asked to map “points of interest,” though under the condition that these points should be of interest for possible tourists. The authors argue that instead of addressing the needs of the local inhabitants, Google prioritized economic over social forms of inclusion, and this project turned out to be a neocolonialist mapping effort focused on economic incorporation.
The Local Guides program works in a similar way. By discursively constructing local (women-owned) businesses as invisible and Local Guides as empowered, Google’s financially-oriented mapping effort is framed as a means for socioeconomic inclusion. However, as already stressed, the problem of online invisibility is created by Google Maps itself, and local businesses must abide by the rules of this platform in order to not miss out on income.
Consequences
A main result of this commercially oriented representation of the world is that the people living in the physical space the map represents increasingly change their habits to comply with the logics of the map. The contributors believe they are making a difference by helping others, while actually they are only helping to improve Google’s database. And by doing so, they consolidate Google Maps’ commercially oriented representation of the world in which online invisibility is indeed a problem.
We should know that maps display a specific point of view. And that by using a map, we may be supporting the particular point of view of its maker.
On Google Maps, the representation of the world is influenced by commercial motives: it is in Google’s business interest to make companies’ online visibility dependent on a gamified system like the Local Guides program. But the framing, scale of use and application of their map in third-party services obscure Google Maps’ commercially oriented subjectivity and give the map the appearance of a neutral, ontologically secure tool that can be used for counter-mapping purposes.
What can we do?
The consequences of Google’s obscured commercial subjectivity can be counteracted by raising awareness on the partial perspective of maps in general (Propen, 2009, p. 115). Counter-mapping initiatives can work to emphasize the partial perspectives of popular maps by representing the world from a different point of view. Alternative, non-commercial or activist mapping platforms can work to destabilize the ontological security of maps and emphasize that any map’s creation is motivated by ideological, political or commercial interests. Further, other mapping platforms such as the collaborative mapping project OpenStreetMap (on which the visibility of places is independent of commercially motivated conditions like the amount of positive reviews) can work as favorable alternatives to Google Maps.
In the end, every map displays a partial perspective. A complete, neutral and still useful map can never exist. In "On the exactitude of Science," his famous short story from 1946, Jorge Luis Borges described an empire where the science of cartography becomes so exact that the cartographers produced a map on the same scale as the empire itself – that map was completely useless. Fortunately, there are plenty of useful maps around. However, whether we are deciding on a choice of a map for daily navigational purposes, using the Google Maps API on our website, or using location data provided by Google to manage a pandemic, before making a decision based on a map, we should know that maps display a specific point of view. And that by using a map, we may be supporting the particular point of view of its maker.
References
Borges, J. L. (1946). On the exactitude of Science. A Universal History of Infamy. Original title: Del rigor en la scienca. Translated by N. Thomas. Penguin Books.
Crampton, J. (2003). The political mapping of cyberspace. Edinburgh University Press.
Del Casino, V. J. & Hanna, S. P. (2000). Representations and identities in tourism map spaces. Progress in Human Geography, 24(1), 23–46.
Del Casino, V. J. & Hanna, S. P. (2005). Beyond the “binaries”: A methodological intervention for interrogating maps as representational practices. ACME: An International E-Journal for Critical Geographies, 4(1), 34–56.
Farman, J. (2010). Mapping the digital empire: Google Earth and the process of postmodern cartography. New media & society, 12(6), 869-888.
Frith, J. (2017). Invisibility through the interface: the social consequences of spatial research. Media, Culture & Society, 39(4), 536-551.
Harris, L. & Hazen, H. (2009). Rethinking maps from a more-than-human perspective: Nature– society, mapping and conservation territories. In R. Kitchin, C. Perkins, & M. Dodge (Eds.) Rethinking maps: New frontiers in cartographic theory (pp. 50-67).
Kitchin, R. & Dodge, M. (2007). Rethinking Maps. Progress in Human Geography, 31(3), 331-344.
Luque-Ayala, A. & Neves Maia, F. (2019). Digital territories: Google maps as a political technique in the re-making of urban informality. Environment and Planning: Society and Space, 37(3), 449–467.
Madrigal, A. C. (2012). How Google builds its maps—and what It means for the future of everything. The Atlantic. Accessed 25-05-2020.
McQuire, S. (2019). One map to rule them all? Google Maps as a digital technical object. Communication and the Public, 4(2), 150-165.
Plantin, J. C. (2018). Google maps as cartographic infrastructure: From participatory mapmaking to database maintenance. International Journal of Communication, 12. 489–506.
Propen, A. D. (2009). Cartographic representation and the construction of lived worlds: Understanding cartographic practice as embodied knowledge. In R. Kitchin, C. Perkins, & M. Dodge (Eds.) Rethinking maps: New frontiers in cartographic theory (pp. 113- 148).